
I have added my real experience into this. you’re just getting started with Zoho Analytics and want a clear, beginner-friendly guide that actually makes sense, you’re in the right place. After working with several BI tools over the years, I can confidently say that Zoho Analytics stands out — it’s one of the rare platforms that combines real power with surprising simplicity.
In this guide, I will take you you through followings:
By the end, you will have enough confidence to start building dashboards that don’t just look nice but actually drive business decisions.
- 1 What Exactly is Zoho Analytics is ?
- 2 Video and Audio Summary
- 3 Why Zoho Analytics Tutorial in 2025?
- 4 Step 1: Setting Up Zoho Analytics
- 5 Step 2: Creating Reports in Zoho Analytics
- 6 Step 3: Building Dashboards in Zoho Analytics
- 7 Step 4: Advanced Features You Should Try in 2025
- 8 Step 5: Best Practices for Zoho Analytics
- 9 Zoho Analytics Pricing in 2025 (Quick Snapshot)
- 10 Who Benefits Most from Zoho Analytics?
- 11 Final Thoughts: Is Zoho Analytics Worth It?
- 12 FAQs on Zoho Analytics Tutorial: Complete Tutorial In 2025
- 13 People Also Ask – Zoho Analytics Tutorial
What Exactly is Zoho Analytics is ?
Let’s make this easy to understand. Zoho Analytics is a self-service business intelligence (BI) and data visualization platform that turns scattered data into clear insights. Instead of juggling numbers across spreadsheets, CRMs, or accounting tools, you can bring everything together in one clean, organized dashboard.
Read More About: What is Business Intelligence (BI) and Why Its Essential for Your Business
Imagine you’re running a small e-commerce store. Your sales data is in Shopify, ads in Google Ads, finances in Zoho Books, and website traffic in Google Analytics. Normally, you’d be switching between five tabs. With Zoho Analytics, you see everything in one dashboard—profit margins, ad ROI, top-selling products, and even trends for next month.
That’s the real magic: it saves you time and shows you insights you wouldn’t notice while hopping between apps.
Read More: Interesting Real Time Cake Business Case Study
Video and Audio Summary
🎧 Listen to the audio summary or watch the short video version below for quick insights on Zoho Analytics Tutorial step by step.
Why Zoho Analytics Tutorial in 2025?
I know what you’re thinking—“There are so many BI tools out there. Why this one?”
Fair question. Here’s why I personally recommend Zoho Analytics in 2025:
- It’s affordable. Compared to Power BI or Tableau, you get a ton of features without burning a hole in your pocket.
- AI is built in. You can literally ask Zia (the AI assistant) questions like “What were my top five products last quarter?” and it will generate a chart.
- It scales with you. Whether you’re analyzing 1,000 rows or millions, it holds up.
- Integrations are everywhere. From Zoho CRM to HubSpot, Salesforce, MySQL, Google Ads—you name it, it connects.
- It’s easy to learn. You don’t need a data science degree. If you can drag and drop, you can use Zoho Analytics.
In short: it’s not overcomplicated, but it’s powerful enough to handle serious data analysis.
Read More About: What is Business Analytics? A Beginners Guide
Step 1: Setting Up Zoho Analytics
You can signup easily by click on this link Zoho Analytics Signup Link
1.1 Sign Up & Get Started
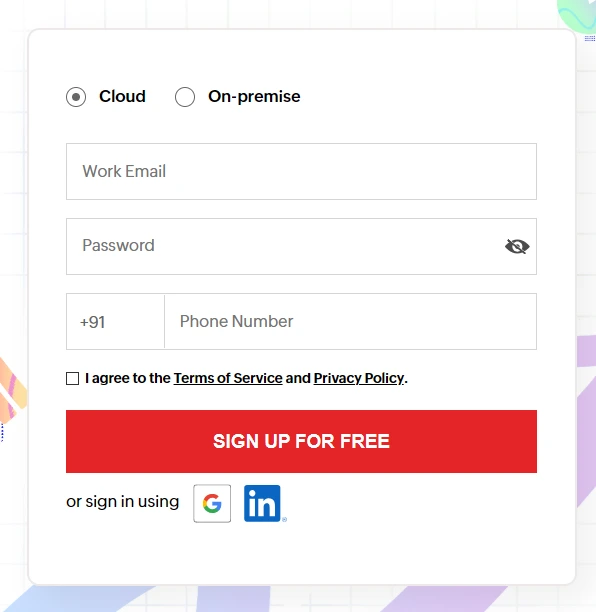
Zoho Analytics provide 2 sets of options
- Cloud – Its completely hosted and maintained by the zoho cloud. All uploaded excel sheet and datasets are stored into zoho cloud server.
- On-Primize – Zoho provides another options to install and setup complete zoho analytics workforce. You can host this into your native cloud system. All uploaded excel sheets and datasets are maintained into your server.
Zoho Analytics provides 15 days trial period on first time signups. You can prefer to signup using google signup , LinkedIn Signup Or you can provide work email, set password and mobile no. In this approach verification code will sent to your mobile no you need to add and verify.
In other 2 Approaches Google signup and LinkedIn signups verification code will sent to your mail id need to verify and also you can verify by click on link attached in the mail.
Once you’re inside, you’ll see a workspace. Think of this as your personal data lab.
1.2 Connecting Your Data Sources
Here’s where the fun starts. You need to bring your data into Zoho Analytics. The good news is, you can connect almost anything:
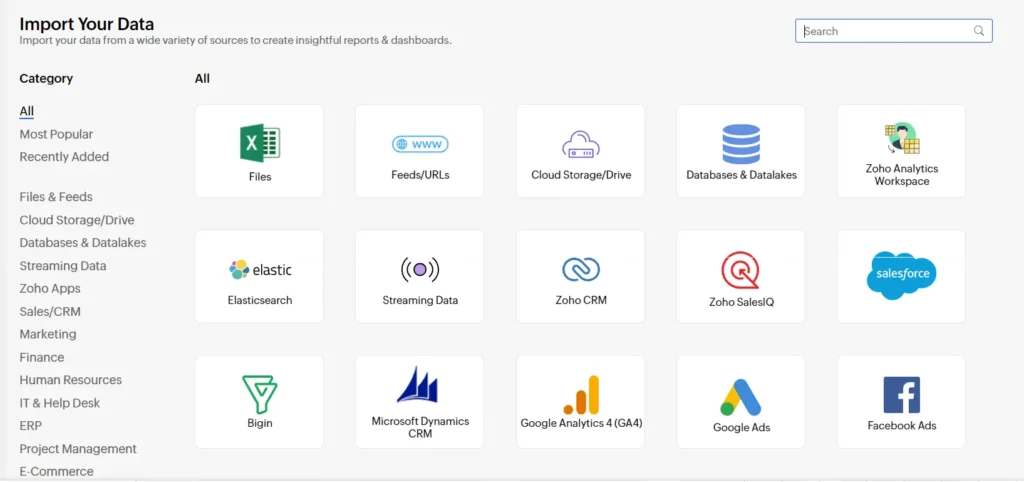
- Zoho Apps: CRM, Books, Projects, People
- Business Apps: Shopify, Google Ads, Facebook Ads, Salesforce, HubSpot
- Databases: MySQL, SQL Server, PostgreSQL, Oracle, Redshift
- Files & Cloud Drives: Excel, CSV, Google Drive, Dropbox
Today Technology is growing faster. Centralized data sets plays a very vital role in the analytics road map. In many time i had debate with many expert on this. why data analysts should spend 40% of their time and energy on data clearing. A company or Business owners should concentrate to create centralized Data center OR Data Lakes with data clearing.
👉 Example 1: One of the famous NGO connected the dataset with database / data lakes for synchronous data access to the report. one of my favorite is amazon RDS. It will provide you to connect with different database platform. Mysql, SQL Server and Postgrey SQL etc.
👉 Example 2: A digital agency I worked with connected Google Ads + Facebook Ads + Zoho CRM. Within hours, they could see which campaigns were generating actual customers, not just clicks.
Pro Tip: Set up scheduled syncs. That way, your dashboards update automatically without you re-uploading data. you can be reach out personally to bilearning.com to know more about what is zoho analytics and zoho analytics tutorial.
1.3 Cleaning & Preparing Data
Let’s be honest—raw data is messy. Before building reports, spend a little time cleaning it:
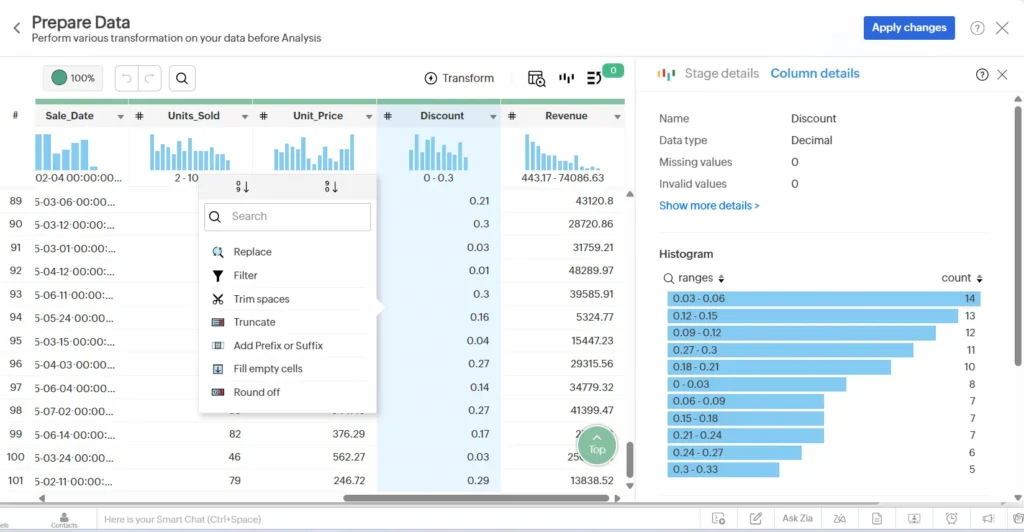
- Fix missing values
- Merge datasets (like combining sales and expense data)
- Create formulas (Profit = Sales – Expense)
- Rename columns so everyone understands them
It feels boring, but trust me: a well-prepared dataset saves you headaches later..
Read More About: How to Set Up a Zoho Analytics MySQL Connection
Step 2: Creating Reports in Zoho Analytics
Reports are the foundation of everything in BI Tool. Here’s how to build your first one:
BI platform provide different blocks. Namely Explorer, Dashboard, Reports , Data , advanced latest feature Ask Zia is enabled for the premium and you can see the more which is used for code studio, Auto ML , Data Source , Settings and Trash.
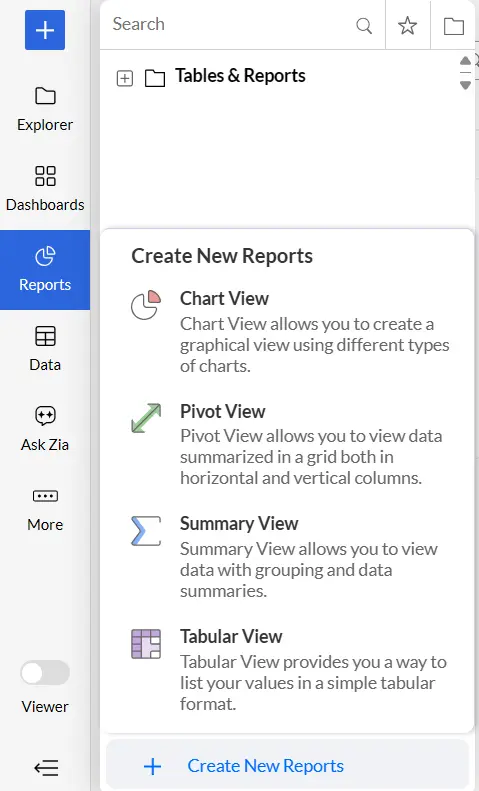
- Go to Create -> Report – Provide different blocks. in that Reports are the used to create a different visualizations.
- Chart View – Chart view basically used to represent the graphical view using different types of charts. I have added some of charts for your reference.
- Bar chart for comparisons
- Line Chart for trends
- Pie chart for proportions
- Pivot View – If you are familiar with excel pivot view then this will a very easy task for you. here you are add no of user filter , different formulas etc.
- Summary View – Summary view its self says view the data with grouping and data summaries.
- Tabular View – Tabular view provides you a way to list your values in simple tabular format.
Each Above reports types are used to generate different insights as per your business needs. make sure that your data cleaning should done perfectly before proceeding for report generation. Other wise you need to
Real Example: I am sharing my personal experience with you all. I once built a sales report that compared monthly revenue by region. The first time I saw the chart, it was obvious that 70% of sales came from just two regions. That insight helped the team double down on marketing in those areas. reach out to bilearnings.com to learn about zoho BI Tool Completly.
💡 Tip: Don’t stop at one chart. Play around with a few types—you’ll be surprised how different visualizations reveal different insights.
Read More: 12 AI Feature in Zoho BI Tool
Step 3: Building Dashboards in Zoho Analytics
This is the part most people enjoy—the visual dashboards.
3.1 Create a New Dashboard
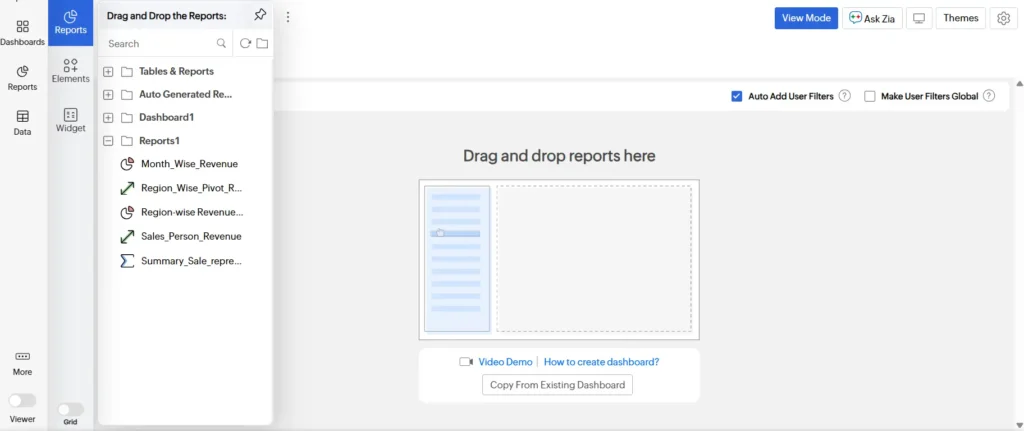
- Go to Create → Dashboard
- Drag in your reports, pivot tables, and KPI widgets
- Arrange them on the canvas (like a collage of insights)
- Once you add multiple reports you can resize and maximize the reports.
3.2 Make It Interactive
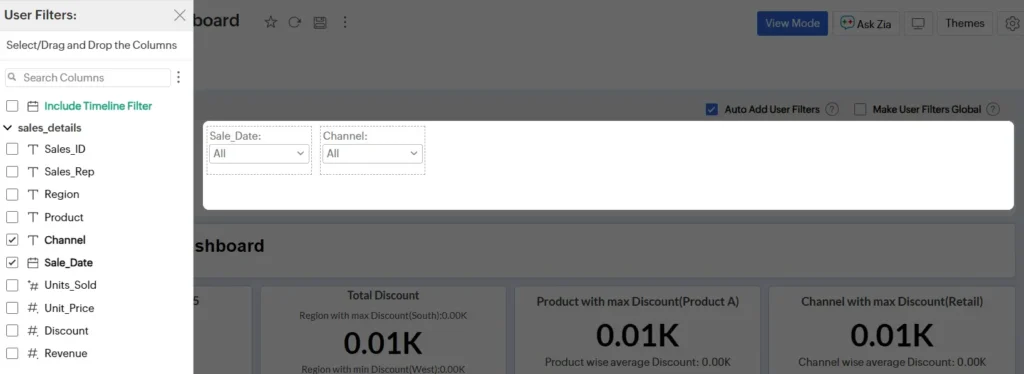
- Add filters like Date Range, Region, Product
- Use KPI widgets for at-a-glance numbers (like Total Revenue or Net Profit)
- Group related charts together for clarity
- even you can provide the filters were you can show the particular results based on the filter values
👉 Example: A Marketing Dashboard might include:
- Leads by channel (Pie chart)
- Conversion rate by campaign (Bar chart)
- Monthly ad spend vs. revenue (Line chart)
- ROI (KPI widget)
3.3 Sharing Your Dashboards
This is where Zoho Analytics shines:
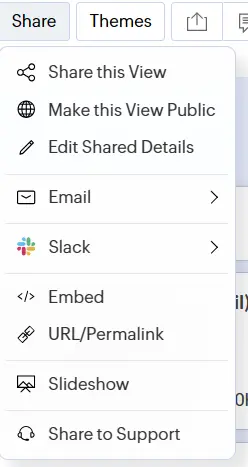
- Share with your team (view/edit/export permissions)
- Publish dashboards on websites or client portals
- Automate email reports weekly or monthly
- Drill-down feature can be control in the dashboard share
- share with specific conditions : ex: employee department=education
- If any slack is integrated into your workspace you can share the dashboard into .pdf or .html
- Slide show is advanced feature of Zoho BI Tool.
One client of mine had their weekly sales dashboard auto-emailed to managers every Monday morning. No one had to “prepare reports” anymore—it just worked.
💡 Pro Tip: Zoho BI Tool allocate 15 private shareable links if you opted the premium version. So if you have any web page you can directly add the shared public on web link into IFrame and utilize unlimited benefits of report sharing.
Use Case of Iframe: If your company or business need to sends any dashboard to funders or board members you can create web page and add respective dashboard into Iframe and provide the link. whenever they land to that link they can see the dashboard which you have added.
Read More About: Zoho Analytics Data Blending: Combine Multiple Data Sources Easily
Step 4: Advanced Features You Should Try in 2025
Once you’re comfortable with the basics, here are some features worth exploring:
4.1 Ask Zia (AI Assistant)
Just type a question in plain English. It will give you real time chart generation. if you ash any count request show me count in the department-name.
Example: “Show me year-over-year growth for Q1.”
4.2 Predictive Analytics
Forecast future sales based on trends.
4.3 Data Alerts
Get notified if something unusual happens (e.g., daily sales drop below $1,000).
4.4 White Labeling
Agencies can rebrand Zoho Analytics and sell it as their own BI tool.
4.5 Mobile App Dashboards
Access your dashboards anywhere—handy if you’re traveling or working remotely.
Step 5: Best Practices for Zoho Analytics
Here are some lessons I’ve learned (sometimes the hard way):
- Keep it simple. Don’t cram 20 charts into one dashboard. Stick to 5–7 key metrics.
- Decide KPIs first. Don’t build a dashboard until you’re clear on what matters.
- Use consistent colors. A small design tweak that makes dashboards easier to read.
- Give access wisely. Share dashboards with the right people, but control editing rights.
- Automate updates. Schedule syncs and emails so data flows in without manual work.
- Review often. Business priorities change—so should your dashboards.
Read More About: Build Interactive Dashboards in Zoho Analytics [With Sample Data]
Read More About: The Ultimate Guide to Zoho Analytics Charts: 30 Powerful Types Explained With Real Examples
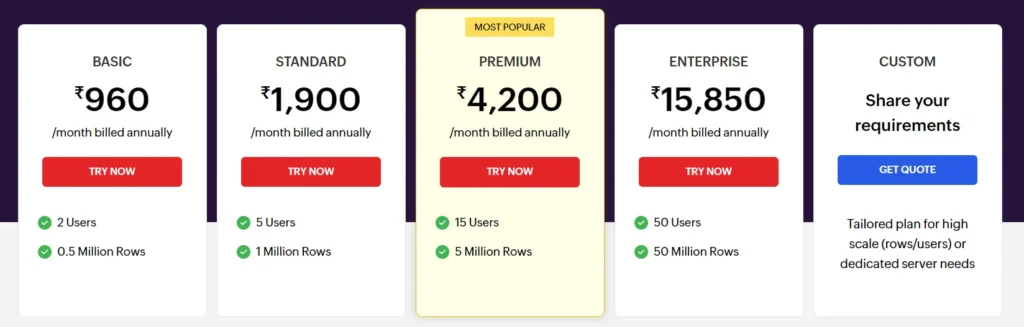
Zoho Analytics Pricing in 2025 (Quick Snapshot)
Zoho Analytics usually offers:
- Free Plan: For individuals/small teams
- Basic & Standard: Great for growing businesses
- Premium & Enterprise: High data limits, advanced features, white labeling
- Custom: The custom pricing will be sent by the zoho analytics sales team. you have to enter your information in the form.
Tip: Start with the trial. Once your are familiar with the analytics tool you can prefer the premium with 50 lacks rows with 15 users and 15 private links.
Who Benefits Most from Zoho Analytics?
Zoho Analytics is perfect for:
- Small Businesses – Easy setup, affordable plans, no heavy IT required.
- Enterprises – Handle millions of rows of data with advanced features.
- Agencies/Consultants – White-label and resell analytics dashboards.
- Non-Technical Users – Drag-and-drop dashboards and AI-powered insights make it beginner-friendly.
- Non-Profit Organizations – For impact analyses, CSR Dashboard generation, dashboard for funders can be generated by connecting data warehouses with simple Drag-and-drop and AI-powered insights make it beginner-friendly.
Read More About: Zoho Analytics Row Level Security
Final Thoughts: Is Zoho Analytics Worth It?
In 2025, the short answer is: Yes.
Thought my experience what I love about Zoho Analytics is that it gives small businesses a chance to use powerful BI without the learning curve of tools like Tableau. And for larger companies, it’s scalable enough to handle complex analysis.
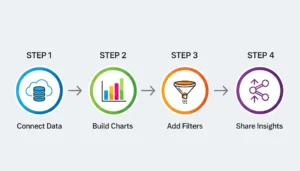
This tutorial showed you how to:
- Set up Zoho Analytics step by step
- Build your first reports and dashboards
- Explore advanced features like AI and predictive analytics
- Apply best practices to make dashboards useful, not overwhelming
If you’ve been sitting on piles of data without clarity, Zoho Analytics is your chance to finally put it to work.
So here’s my suggestion: sign up, connect one data source, and build a simple dashboard today. Once you see your numbers come alive, you’ll realize why data-driven decisions feel so powerful.
✅ Next Step for You: Zoho offers a free 15 days trial for you if you signup first time. so you can start your free trial, connect your most important data sources, and build your first report and dashboard. Once you see your business in one place, you’ll never look at data the same way again.
Read More : Swadeshi SaaS . Growing Tech Platforms
FAQs on Zoho Analytics Tutorial: Complete Tutorial In 2025
Is Zoho Analytics free to use?
Yes, Zoho Analytics offers a free plan with limited features. It’s great if you’re just testing things out or running a small project. For more advanced features like large data storage, AI insights, and white labeling, you’ll need a paid plan.
Do I need coding skills to use Zoho Analytics?
Not at all. Zoho Analytics is built for non-technical users too. You can create reports and dashboards with simple drag-and-drop. That said, if you know SQL, you can write queries for more advanced analysis.
Can Zoho Analytics connect with my existing tools?
Most likely yes. It integrates with 500+ apps, including Zoho CRM, Shopify, Salesforce, Google Ads, HubSpot, and popular databases like MySQL and PostgreSQL. You can also upload Excel/CSV files directly.
What kind of dashboards can I build in Zoho Analytics?
You can build almost any kind—sales dashboards, marketing performance dashboards, financial dashboards, HR dashboards, or even custom ones that blend data from multiple apps. The key is deciding which KPIs matter most to you.
How is Zoho Analytics different from Excel or Google Sheets?
Spreadsheets are great for small datasets, but they get messy as your data grows. Zoho Analytics not only stores larger volumes of data but also gives you interactive charts, AI-driven insights, and automated syncing from multiple sources—things spreadsheets simply can’t handle efficiently.
Can I share my Zoho Analytics dashboards with my team?
Yes. You can invite team members, control who can view or edit dashboards, and even schedule automatic email reports. Agencies can go one step further by embedding dashboards for their clients.
Does Zoho Analytics work on mobile?
Yes. Zoho has a mobile app for iOS and Android, so you can access dashboards and reports on the go. The app is pretty smooth and optimized for quick insights.
Is Zoho Analytics good for small businesses?
Absolutely. Many small businesses prefer it because it’s affordable, quick to set up, and doesn’t need a full-time IT team. It scales as your business grows, so you won’t outgrow it quickly.
How secure is my data in Zoho Analytics?
Zoho takes security seriously. Your data is encrypted, access can be restricted by role, and you can set permissions for each user. For companies needing compliance, Zoho is GDPR and HIPAA ready.
Can Zoho Analytics predict future trends?
Yes, that’s one of its strongest features. Using predictive analytics, you can forecast sales, expenses, or churn based on past data. It’s not perfect, but it gives you a good direction for planning ahead.
People Also Ask – Zoho Analytics Tutorial
How do I start using Zoho Analytics?
To start with Zoho Analytics, sign up for a free account, connect your data source (like CRM, Excel, or databases), and create your first report using drag-and-drop charts. Within minutes, you’ll have a working dashboard ready.
Is Zoho Analytics easy for beginners?
Yes, Zoho Analytics is beginner-friendly. You don’t need coding skills—most reports and dashboards can be created using simple drag-and-drop. The platform also has built-in templates and AI assistant “Zia” to guide you.
What can I do with Zoho Analytics dashboards?
Zoho Analytics dashboards let you combine multiple reports into one interactive view. You can track KPIs, compare trends, apply filters, and share dashboards with your team or clients. They’re useful for sales, marketing, finance, and operations.
Does Zoho Analytics support predictive analytics?
Yes, Zoho Analytics includes predictive analytics. It can forecast sales, revenue, or customer churn by analyzing historical data. This helps businesses plan budgets, resources, and campaigns more effectively.
Can I integrate Zoho Analytics with Google Sheets or Excel?
Absolutely. You can directly upload Excel or CSV files, or connect Google Sheets for automatic sync. This makes it easy to move from spreadsheets to interactive reports without starting from scratch.


15 thoughts on “Zoho Analytics Tutorial: Complete Tutorial for 2025 [Setup, Dashboards & Best Practices]”
Comments are closed.