Introduction
Spreadsheets are powerful, but let’s be honest—sometimes they’re just exhausting to look at. You scroll, you filter, you squint—and still can’t quite tell what’s going on. That’s the reality of raw data. It’s all there, but the story is buried.
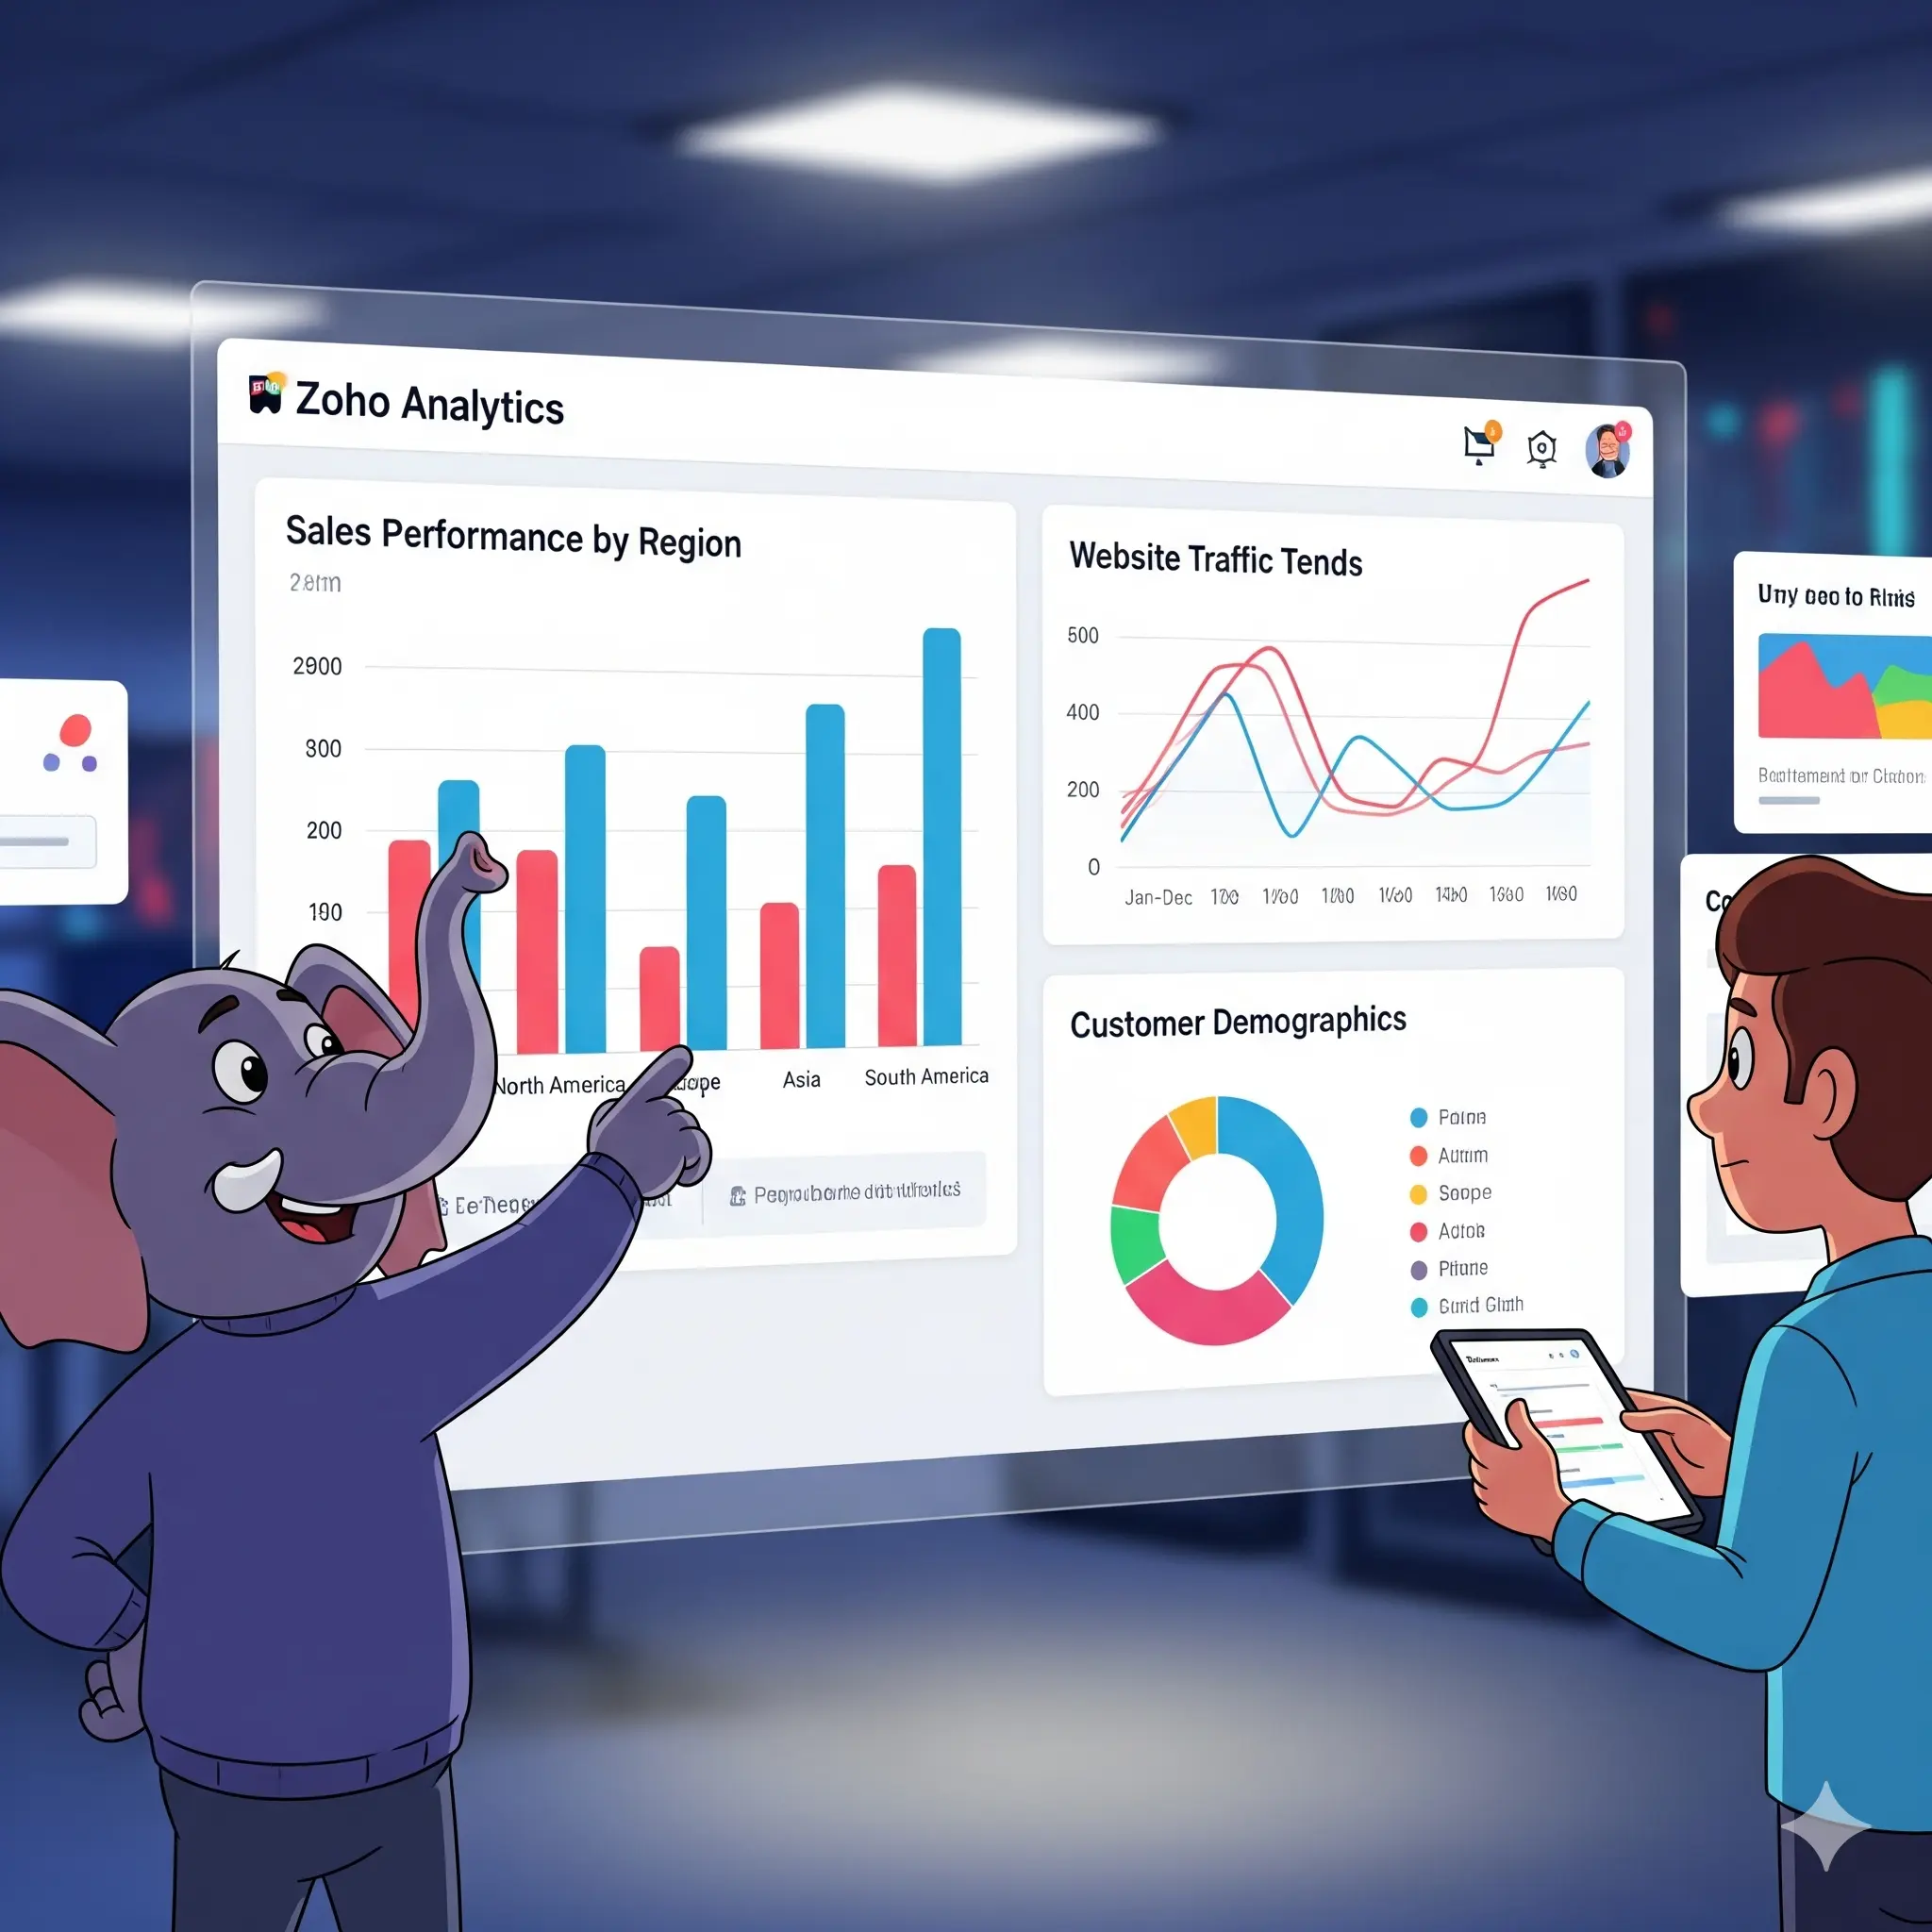
Dashboards flip that problem on its head. Instead of staring at endless numbers, you see charts, KPIs, and trends that make sense at a glance. If you’re curious about how to build one, this Zoho Analytics dashboard tutorial will take you step by step. The good part? You don’t even need your own company data to practice. Zoho gives you sample datasets to play with.
So let’s start there.
Learn Online Tutorials from World’s largest plat Udemy
Why Bother with a Dashboard?
Let’s take a moment to look at the reason behind it before we get into the process.
Zoho Analytics is not the only BI tool out there, but it’s one of the easiest to get started with. Think of it like this:
- You don’t need to know code. Drag and drop does the heavy lifting.
- You’re not stuck with one data source. A spreadsheet, a CRM, a database—it can handle all of them.
- Dashboards aren’t static. You can add filters, drill down into details, and interact with the numbers.
- Sharing is straightforward. Whether it’s your team or external stakeholders, everyone can view insights in real time.
Basically, dashboards let you spend less time wrangling data and more time acting on it.
Starting Small: Practice with Sample Data
Nobody wants to risk breaking live company data while learning. That’s why sample datasets are so useful. Zoho Analytics comes with a handful of ready-made dashboards—sales, marketing, HR, and finance.
Here’s how you can use them:
- First step: log into Zoho Analytics. A trial account is perfectly fine for practice.
- Find the ‘Import Data’ option and load in one of the sample sets Zoho provides.
- Browse through the tables and sample reports.
Now you have data to practice with—safe, simple, and realistic enough to teach you how dashboards behave.
Read More: Zoho Analytics Tutorial: Complete Tutorial [Setup, Dashboards & Best Practices]
Step-by-Step Zoho Analytics Dashboard Tutorial
Let’s build a dashboard together.
1. Create a Dashboard Workspace
Click Create > Dashboard, and give it a clear name like Sales Overview or Monthly Tracker.
2. Bring in Charts and Reports
Your dashboard will be empty at first. Now add visuals:
- A bar chart showing monthly revenue.
- Build a pie chart that visualizes sales for each product category.
- A line graph to track performance over time.
You can drag existing reports from your workspace or create new ones on the spot.
3. Arrange It Neatly
Nobody likes a cluttered dashboard. Put the most important numbers at the top, group similar charts together, and adjust sizes so everything is readable.
4. Add Filters for Interaction
Filters make dashboards powerful. It’s not just one fixed view—you can change how you look at the data:
- Date range (last 7 days, last quarter, this year).
- Region or branch office.
- Product type or category.
With filters, anyone viewing the dashboard can dive into the details that matter most to them.
5. Highlight Key Metrics with Widgets
Sometimes you don’t need a chart—you just need a number. Widgets are great for showing things like:
- Total revenue this month.
- New customers added.
- Average deal size.
These give quick “headline” figures that matter most.
6. Adjust the Design
Zoho gives you options to tweak fonts, colors, and layout. Keep it simple. Use your brand colors if you’re planning to share the dashboard with clients or executives.
7. Share or Publish
When you’re happy with the layout:
- Share it with team members (you can control who sees what).
- Publish it as a private link.
- Or embed it into your internal site.

A Few Best Practices
Here’s where people often trip up:
- Don’t add everything. Pick the KPIs that actually drive decisions.
- Use filters carefully. Too many options can overwhelm users.
- Keep the visuals clean. Flashy colors and crowded charts look cool, but they distract.
- Make sure the data refreshes on schedule. Outdated numbers are worse than no numbers.
Why Practicing with Sample Data Helps
If you’re wondering whether sample data is “worth it,” here’s why it matters:
- It’s safe. You’re not touching live business files.
- It’s quick. You don’t have to wait for access to real datasets.
- It’s varied. Sales, HR, finance—you can test different dashboard styles.
By the time you switch to your company’s data, you’ll already know what works. the zoho analytics dashboard tutorial will help you to generate the insights.
Read More: How to Set Up a Zoho Analytics MySQL Connection
Going Beyond Basics
Once you’re comfortable, you can take dashboards further.
- Drill-down reports: click a chart to see more details.
- Conditional formatting: highlight KPIs in green, amber, or red.
- Data blending: combine CRM numbers with financials for a bigger picture.
- Zia AI: ask questions like “show me last quarter’s top customers” and get instant results.
These are the features that make dashboards not just useful but genuinely insightful. so you will be learning many thing in this Zoho Analytics Dashboard Tutorial.
Wrapping It Up
The Zoho Analytics dashboard tutorial help you to Think of dashboards as the translator between data and decisions. And the best part?Creating them doesn’t require expert skills.
In this Zoho Analytics dashboard tutorial, we went from sample data to building charts, adding filters, arranging widgets, and publishing a shareable view. It’s not about making something “pretty”—it’s about making something useful.
So, open Zoho Analytics, load up the sample datasets, and start experimenting. The more dashboards you build, the easier it becomes to design ones that tell the story behind the numbers.
FAQs on Building Interactive Dashboards in Zoho Analytics
1. What’s a Zoho Analytics dashboard?
It’s a collection of reports, charts, and metrics displayed together for quick insights.
2. Do I need my own data to practice?
No. Zoho offers sample datasets like Sales, HR, and Finance.
3. How do I make a dashboard interactive?
By adding filters, widgets, and drill-down options.
4. Can I share dashboards with others?
Yes. You can set permissions, publish links, or embed dashboards.
5. Do I need coding to build dashboards?
Not at all. It’s drag-and-drop. Advanced users can add SQL for extra customization.
7. Is Zoho Analytics free?
There is a limited free plan and a trial. Paid plans unlock more features like blending multiple data sources.


3 thoughts on “Build Interactive Dashboards in Zoho Analytics [With Sample Data]”
Comments are closed.