
- 1 Introduction: Why Business Analytics Matters Today
- 2 What is Business Analytics? A Beginners Guide in 2025
- 3 Why Business Analytics is Important in Todays World
- 4 Types of Business Analytics
- 5 Real-World Applications of Business Analytics
- 6 Challenges Beginners Face in Business Analytics
- 7 How to Get Started with Business Analytics (Beginners Roadmap)
- 8 Conclusion
- 9 Frequently Asked Questions (FAQs) about Business Analytics
Introduction: Why Business Analytics Matters Today
What is Business Analytics? A Beginners Guide in 2025 is very essentials to know about the analytics for business improvements. Not long ago, business decisions were made mostly by intuition, experience, and a little bit of guesswork. A shopkeeper knew which products sold because he observed customer behavior daily. A factory manager decided on production volumes by following seasonal trends. While this worked for a while, today’s businesses face a completely different landscape.
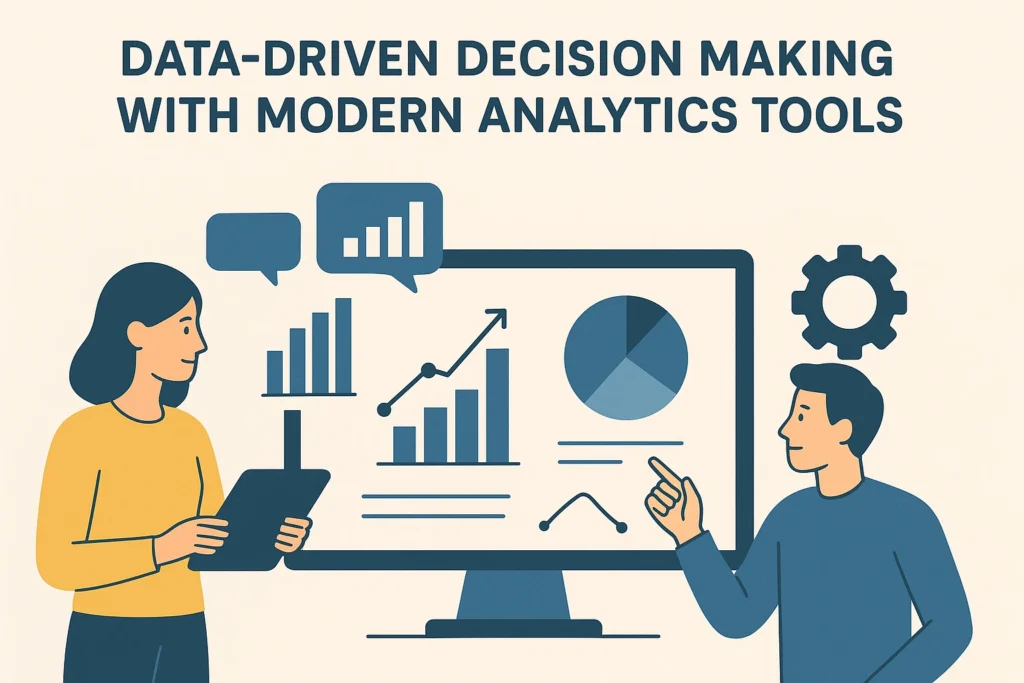
Every interaction — a customer purchase, a website click, a social media comment — leaves behind data. This data, if analyzed properly, reveals patterns that intuition alone can’t capture. That’s where business analytics comes in.
Business analytics is not just about crunching numbers. It’s about turning raw data into insights that help organizations make smarter, faster, and more confident decisions. Whether you are a small business owner, a student aspiring to enter the analytics field, or a manager looking to improve decision-making, understanding business analytics is no longer optional. It’s a skill and a mindset that defines the future of work. This will cover up the What is Business Analytics? A Beginners Guide in 2025
What is Business Analytics? A Beginners Guide in 2025
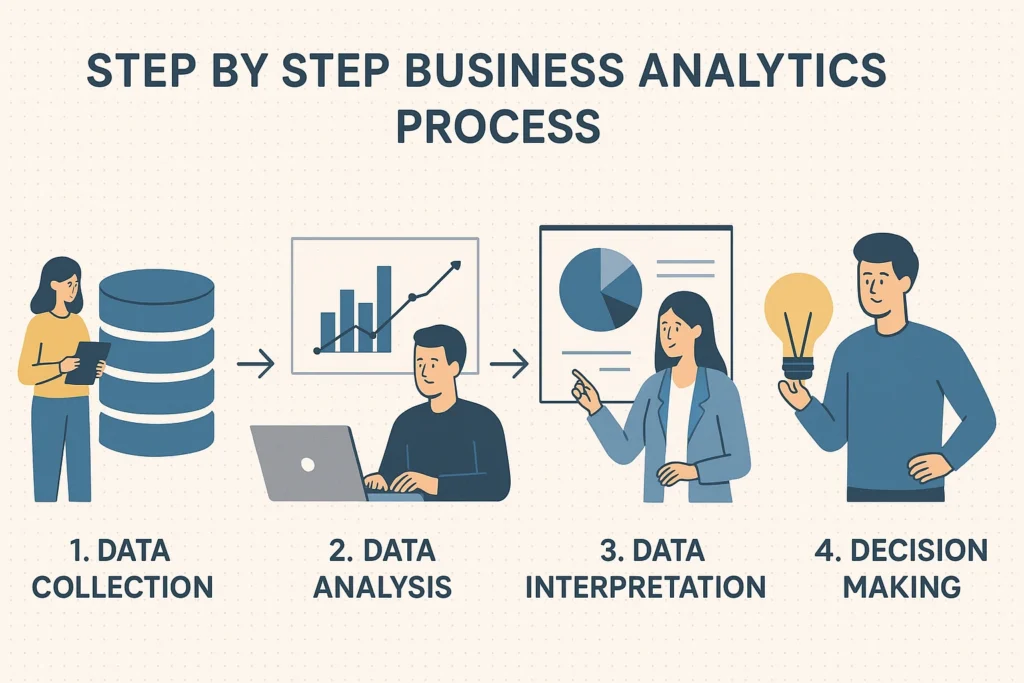
At its core, business analytics (BA) is the practice of exploring historical data, applying statistical methods, and using technology tools to gain insights that drive better decisions.
Think of it like this:
- Data is the raw material (like wheat).
- Analytics is the process of milling, kneading, and baking.
- Insights are the bread that everyone can consume and act upon.
Instead of asking, “What do I think will happen?” business analytics allows you to ask, “What does the data say, and how confident am I about that?”
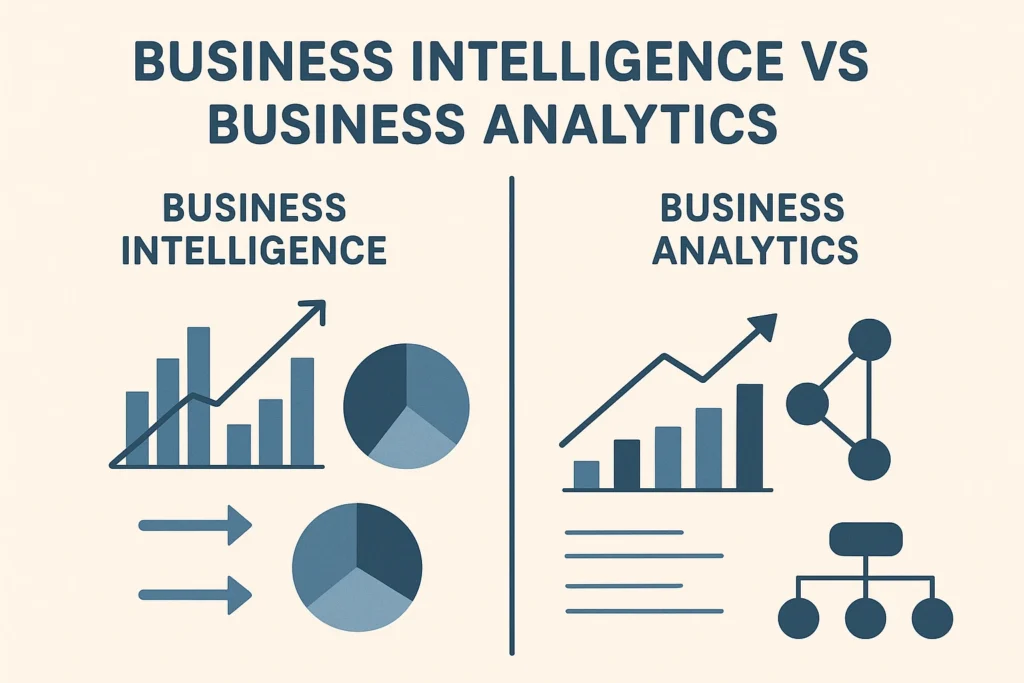
Some beginners confuse business analytics with business intelligence (BI) and data science. While these areas overlap, business analytics specifically emphasizes decision-making, using historical and current data to improve business outcomes. BI focuses more on reporting and dashboards, while data science dives deeper into algorithms and machine learning.
Why Business Analytics is Important in Todays World
Imagine you are running an online clothing store. You notice that sales have dropped in the past two months. Without analytics, you might assume the cause is increased competition or poor marketing. But when you dig into the data, you may discover:
- Customers are abandoning their carts because delivery costs increased.
- Sales of women’s wear are stable, but men’s wear has declined sharply.
- Your social media ads are reaching audiences outside your target demographic.
This type of evidence-based decision-making is the essence of business analytics.
Some key reasons why business analytics matters today:
- Data Explosion – Every business, big or small, now generates data. Without analysis, it’s just noise.
- Competitive Edge – Companies that understand their data respond faster to market changes.
- Cost Savings – Analytics highlights inefficiencies in operations.
- Customer-Centric Strategies – By understanding customer behavior, businesses can design better experiences.
- Risk Reduction – Predictive analytics helps in identifying risks before they become crises.
Types of Business Analytics
Business analytics is often divided into four main categories. Each type answers a different business question you have to get the knowledge on What is Business Analytics? A Beginners Guide in 2025
1. Descriptive Analytics – “What Happened?”
This is the simplest form. It reviews historical data to show you what has already taken place.. For example:
- Last quarter’s sales reports.
- Monthly website traffic numbers.
- Customer satisfaction survey summaries.
Example: A retail chain reviewing last year’s sales across different regions to see which products performed best.
2. Diagnostic Analytics – “Why Did It Happen?”
This digs deeper to understand the reasons behind the trends. It involves root-cause analysis, often using statistical methods.
Example: A telecom company investigating why customer churn increased in one city. By analyzing call quality, billing issues, and competitor offers, they identify the main cause.
3. Predictive Analytics – “What Could Happen?”
Through models and forecasting, it helps project possible results ahead of time.
Example: An e-commerce platform predicting how sales might rise during a festive season, based on past seasonal data.
4. Prescriptive Analytics – “What Should We Do?”
The most advanced type. It doesn’t just forecast outcomes but also guides you on the right decisions.
Example: A logistics company using prescriptive analytics to determine the most efficient delivery routes while reducing fuel costs.
Real-World Applications of Business Analytics
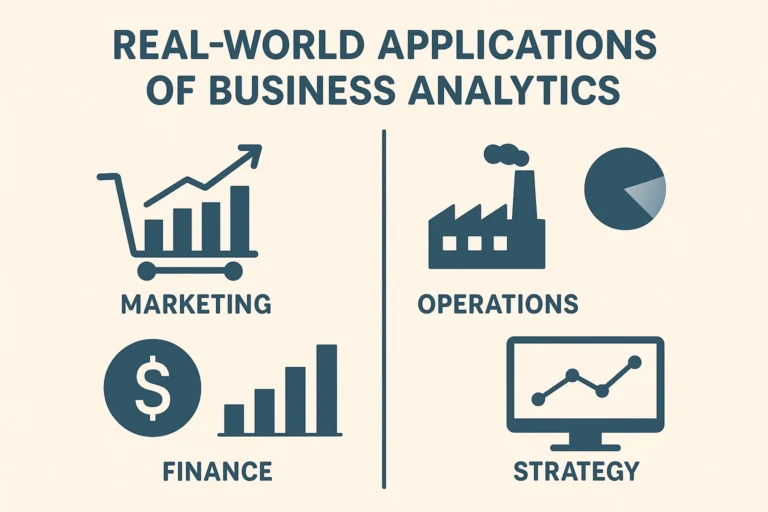
Business analytics is not limited to large corporations. In fact, small and medium enterprises (SMEs) in India and other countries are increasingly adopting analytics. Let’s look at a few industries:
- Retail – Tracking customer buying patterns, optimizing product placement, and planning seasonal discounts.
- Healthcare – Using patient records to improve treatment plans and predict disease outbreaks.
- Education – Universities analyzing student performance data to design better learning interventions.
- Banking & Finance – Detecting fraudulent transactions and personalizing investment advice.
- Manufacturing – Predicting machine breakdowns to schedule preventive maintenance.
Non-profits and government agencies are now using analytics to understand how well their initiatives are working.
Challenges Beginners Face in Business Analytics
While the benefits are clear, beginners often face some common challenges:
- Data Quality – If your data is incomplete or inconsistent, your insights will be unreliable.
- Too Many Tools – From Excel to Zoho Analytics, Power BI, and Tableau, the number of tools can feel overwhelming.
- Skill Gap – Analytics requires a mix of business knowledge, statistics, and technical know-how. Beginners may struggle to balance all three.
- Shifting perspective – Many companies are guided more by intuition than insights.
The good news? These challenges can be overcome with structured learning What is Business Analytics? A Beginners Guide in 2025 and practice.
How to Get Started with Business Analytics (Beginners Roadmap)
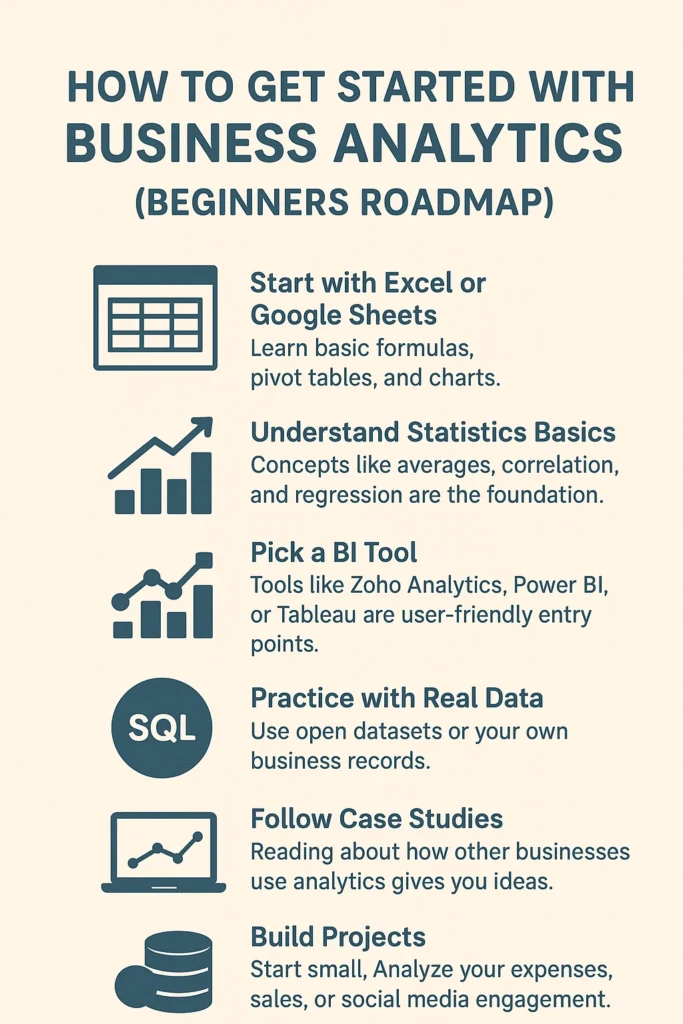
If you are new to this field, here’s a practical learning path:
- Start with Excel or Google Sheets – Learn basic formulas, pivot tables, and charts.
- Understand Statistics Basics – Concepts like averages, correlation, and regression are the foundation.
- Pick a BI Tool – Tools like Zoho Analytics, Power BI, or Tableau are user-friendly entry points.
- Practice with Real Data – Use open datasets or your own business records.
- Learn SQL – Knowing how to query databases is essential for serious analytics work.
- Follow Case Studies – Reading about how other businesses use analytics gives you ideas.
- Build Projects – Start small. Analyze your expenses, sales, or social media engagement.
Consistency matters more than speed. Over time, you’ll build both technical confidence and business intuition.
What is Business Intelligence In 2025
The Essential Guide to Business Intelligence (BI)
Conclusion
Business analytics is not just a technical buzzword. It’s a mindset that combines curiosity, logic, and evidence to solve real business problems. For beginners, the journey may feel overwhelming, but the rewards are worth it. Every company — from startups to multinationals — needs professionals who can make sense of data.
If you’re just starting, focus on the basics, practice consistently, and don’t be afraid of mistakes. Remember, even the best analysts started with simple spreadsheets. The key is not perfection, but persistence.
Best Business Intelligence Tool Click here to Get Zoho Analytics free $100
Frequently Asked Questions (FAQs) about Business Analytics
What exactly is business analytics?
Business analytics is the process of using data, statistical methods, and tools to understand business performance and make smarter decisions. Instead of guessing, companies rely on data insights to improve sales, operations, customer experience, and long-term strategy.
Why is business analytics important in 2025?
In 2025, businesses deal with massive amounts of data every day—from customer interactions to supply chain operations. Business analytics helps turn that raw data into practical insights. It’s not just about reports; it’s about predicting trends, spotting risks early, and finding new opportunities faster than competitors.
Is business analytics the same as business intelligence?
Not exactly. Business intelligence (BI) mainly focuses on what has already happened using dashboards and reports. Business analytics goes a step further—it explains why something happened and predicts what could happen next. Both are useful, but analytics gives a more forward-looking view.
Do I need to be good at math or coding to start with business analytics?
Not really. You don’t need to be a math wizard or a hardcore programmer. A basic understanding of statistics and a willingness to learn simple tools like Excel, Google Sheets, or beginner-friendly BI platforms (like Power BI, Tableau, or Zoho Analytics) is enough to start. As you grow, learning SQL or Python can give you an edge.
What skills should beginners focus on first?
If you’re new, start with:
Excel or Google Sheets (formulas, pivot tables, charts)
Basic statistics (averages, correlation, regression)
BI tools like Power BI, Tableau, or Zoho Analytics
SQL for querying data
These skills create a strong foundation before moving into advanced analytics.
What are some real-world uses of business analytics?
Business analytics is everywhere. For example:
Marketing – Targeting the right audience and improving campaigns
Finance – Detecting fraud and managing risks
Operations – Optimizing supply chains and reducing costs
Customer service – Predicting customer needs and improving satisfaction
Can small businesses use business analytics too?
Absolutely. You don’t need to be a large corporation to benefit. Small businesses can use simple tools to track expenses, analyze sales trends, or measure customer behavior. Even basic insights can make a big difference in decision-making.
What tools are best for beginners in 2025?
Some of the most user-friendly tools include:
Zoho Analytics – Great for SMEs and easy integration
Power BI – Best for Microsoft ecosystem users
Tableau – Excellent for visualization and dashboards
Google Looker Studio – Free and good for quick reports
How do I practice business analytics as a beginner?
Start small. Use open datasets available online or your own data like expenses, sales, or website traffic. Try building dashboards, finding patterns, and drawing conclusions. The more you practice with real data, the more confident you’ll become.
What is the career scope of business analytics in 2025?
The demand is huge. Almost every industry—healthcare, finance, retail, e-commerce, and IT—needs data-driven professionals. Roles like Data Analyst, Business Analyst, and BI Developer are in high demand, and analytics skills often lead to better-paying jobs.


6 thoughts on “Business Analytics in 2025: How It Transforms Data Into Smarter Decisions”
Comments are closed.